
235,715
Delivered orders

Searching someone who can help with assignment help online? Hire our best assignment experts and enjoy the best grade.
the rapid growth of data in the modern era, extracting valuable information and performing accurate data
rogramming assignments are the tasks and projects which are assigned to the students. These assignments focus on the
W
ith the data zeal and explosion in the
analysis has become a major concern for many industries. In such a data-driven environment, the combination of statistics and data science has opened new opportunities for experimentation, innovation, and evidence-based decision-making.
current era, extracting valuable information and data analysis has become a major concern for major industries. In such a burning scenario, the coalition of statistics and data science has flung open the gates of experiment and innovation, with statistics creating a breakthrough in data science.
From meaningful insights, machine learning, model evaluation, feature engineering, and statistics for data science, learning statistical concepts has become essential for students who want to understand how data is collected, cleaned, analysed, and used for prediction.
To learn more about why statistics is important in data science and get insights into its practical uses, check the analysis below. However, for any assignment assistance in both domains, students can reach out to Assignment World for data science assignment help, statistics assignment help, and academic guidance from an online assignment writer.

Ever since the combination of the two domains, innovation has received stronger direction than ever before. From advanced data analysis and interpretation to the development of predictive models, why statistics is important in data science needs no further mention.
Not just data analysis and modelling, machine learning algorithms are now built on statistical principles, strengthening the impact of statistics in data science practices. For students who want to know more about how to learn statistics for data science, start with the foundations, including descriptive statistics and probability.
With a grasp of the fundamentals, you can further learn about statistical software applications, data visualisation, hypothesis testing, regression models, probability distributions, and predictive modelling.
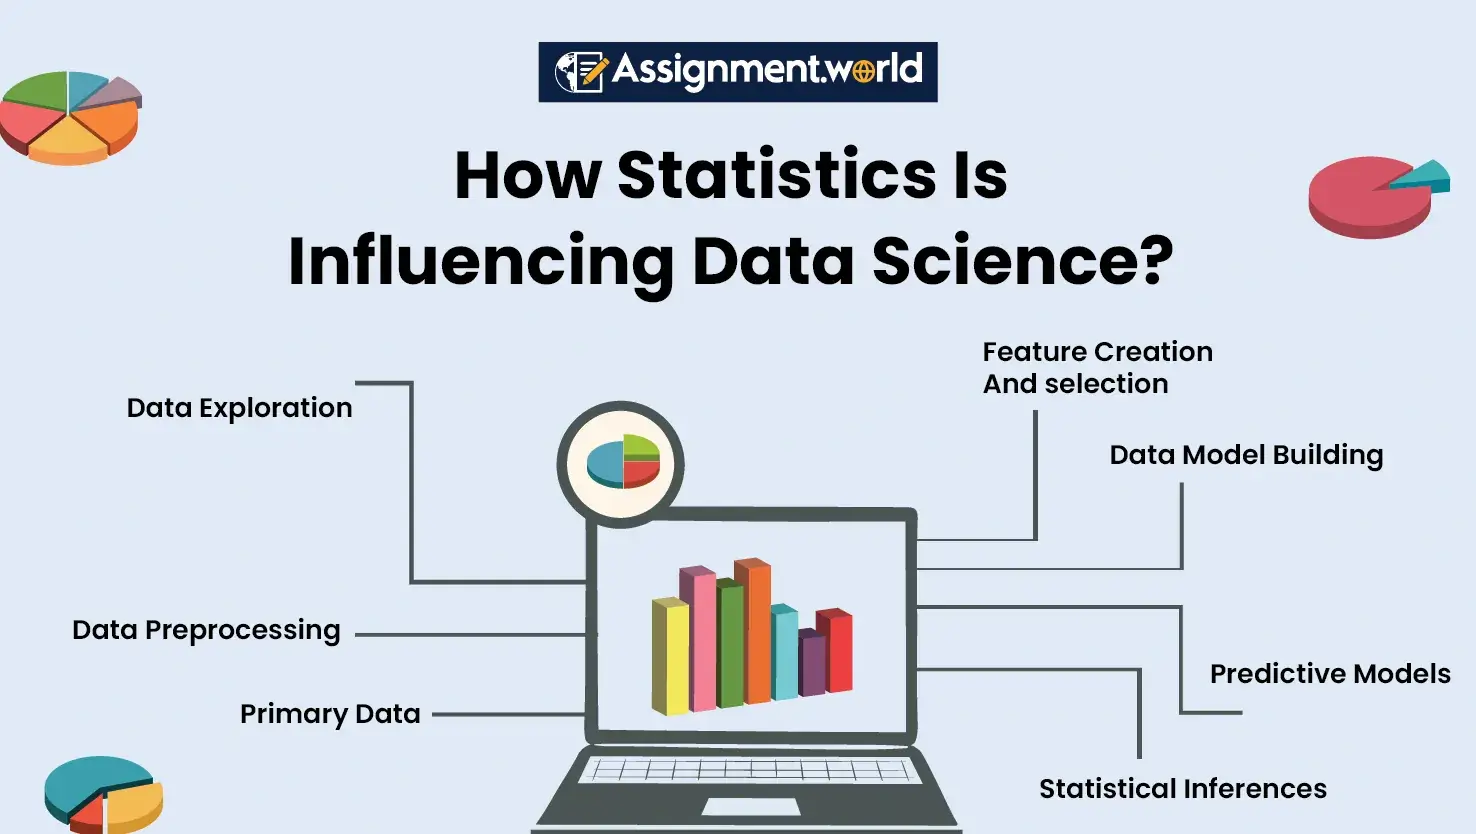
Types of Statistics in Data Science help students understand how raw data becomes meaningful information. Broadly, statistics can be divided into descriptive statistics and inferential statistics.
Descriptive Statistics
Descriptive statistics is used for summarising data that already exists. It helps data scientists understand patterns, averages, spread, frequency, and distribution in a dataset.
Common descriptive statistics include:
Mean
Median
Mode
Range
Variance
Standard deviation
Percentiles
Frequency tables
Charts and graphs
For example, a retail company may use descriptive statistics to summarise customer spending, average order value, and monthly sales trends. These methods let data scientists rapidly make sense of large datasets and find patterns, trends, and distributions in basic statistics for data science.
Inferential Statistics
Inferential statistics helps data scientists make predictions or conclusions about a larger population based on a smaller sample. It includes methods such as confidence intervals, hypothesis testing, regression analysis, and sampling.
For example, a data scientist may survey 1,000 customers and use inferential statistics to estimate the buying behaviour of 100,000 customers.
These two parts work together to form the core of data science statistics: one explains what has already happened, and the other helps forecast what may happen next.
Another important idea in statistics for data science is probability distributions. They provide a way to use mathematics to understand uncertainty and variability in basic statistics for data science.
Probability distributions show how likely different outcomes are. They are useful when data scientists need to model uncertain events, predict future behaviour, or understand how values are spread across a dataset.
Common probability distributions include:
Normal Distribution: A Used when data follows a bell-shaped curve, such as height, exam scores, or measurement errors.
Binomial Distribution: Used when there are only two possible outcomes, such as success/failure or yes/no responses.
Poisson Distribution: Used to model how often an event occurs in a fixed period, such as website visits, customer complaints, or system errors.
Uniform Distribution: Used when all outcomes have equal probability.
Probability mass functions, probability density functions, and cumulative distribution functions are useful for modelling both discrete and continuous data.
Data scientists employ distributions like normal, binomial, and Poisson to describe things like consumer activity, system problems, or user engagement in statistical methods in data science. By learning probability distributions, data scientists can choose the right algorithms, find unusual patterns, and build stronger prediction systems.
This is also a key concept when exploring how to learn statistics for data science.
Hypothesis testing is one of the most important statistical methods in data science because it helps data scientists test assumptions using evidence.
A hypothesis test usually begins with two ideas:
Null Hypothesis: This assumes there is no effect, no difference, or no relationship between variables.
Alternative Hypothesis: This suggests that there is an effect, difference, or relationship between variables.
For example, a company may test whether a new website design increases sales. The null hypothesis may state that the new design has no effect, while the alternative hypothesis may state that the new design improves sales.
Important parts of hypothesis testing include:
P-value
Significance level
Confidence interval
Sample size
Test statistic
One-tailed and two-tailed tests
A low p-value may suggest that the result is statistically significant, while a high p-value may suggest weak evidence against the null hypothesis.
Hypothesis testing is used in A/B testing, product experiments, marketing campaigns, medical research, and machine learning model evaluation.
In statistics for data science, regression models are very important for finding links between variables and making predictions. More sophisticated regression methods may work with more than one variable and more complicated connections, which gives a better understanding of the data in data science statistics.
Regression models help answer questions such as:
How does advertising spend affect sales?
How does temperature affect electricity usage?
How does customer age affect buying behaviour?
How does study time affect exam performance?
Common regression models include:
Linear Regression: Used to predict a continuous value, such as sales, price, or temperature.
Multiple Regression: Used when more than one independent variable affects the outcome.
Logistic Regression: Used for classification problems, such as predicting whether a customer will buy or not buy.
Polynomial Regression: Used when the relationship between variables is curved rather than straight.
Regression is a key part of both statistics and machine learning since it helps predict future outcomes and understand how strong or weak the links are between different variables in statistical methods in data science.
One of the first and most important phases in the data science process is summarising data in statistics for data science. This turns raw, unstructured data into a format that is simpler to analyse and understand.
This means finding patterns and trends by calculating measures of central tendency, dispersion, and distribution shape, as well as using visualisation tools in basic statistics for data science.
Data can be summarised through:
Tables
Charts
Histograms
Box plots
Scatter plots
Mean and median values
Standard deviation
Percentages
Grouped categories
For example, if a dataset contains thousands of customer reviews, summary statistics can show average ratings, common complaint categories, and satisfaction trends.
It is hard to get useful information or make sure that later models are correct without good summarisation.
Another important goal of statistical analysis in statistics for data science is identifying relationships between different variables. Correlation and covariance are two ways to find out how strong and in what direction links exist between variables in statistics in data science.
Correlation coefficients may be anything from -1 to +1:
+1 means a strong positive relationship
0 means no clear relationship
-1 means a strong negative relationship
For example, a positive correlation may exist between advertising spend and sales revenue. A negative correlation may exist between product price and customer demand.
However, students must remember that correlation does not always mean causation. Two variables may move together without one directly causing the other.
To choose the right features, explore the data, and construct good prediction models, you need to know how these things are related, which is a core topic in data science statistics.
Business Decision-Making
Statistics helps businesses understand customer behaviour, sales trends, product performance, and operational risks. It allows companies to make decisions based on evidence rather than assumptions.
For example, a retailer can use statistics in data science to identify which products sell best during particular seasons.
A/B Testing And Experimentation
A/B testing is a common statistical strategy that compares two versions of a product, page, or service to see which one works better. Many companies use it for digital marketing, UI/UX optimisation, email campaigns, and product development in statistics in data science.
Healthcare And Medical Research
Statistics helps healthcare professionals analyse patient data, track disease patterns, study treatment outcomes, and predict health risks.
For example, predictive models may help identify patients who are at higher risk of readmission.
Finance And Risk Assessment
Financial institutions use statistical models to assess credit risk, detect fraud, forecast stock movements, and evaluate investment behaviour.
For example, banks may use regression models to predict loan default risk.
All of these statistical ideas come together in Predictive Modeling, where data scientists build models that are useful in the real world using statistics for data science.
Using past data to predict future events is called predictive modelling. Statistical approaches help make sure that models are accurate, reliable, and easy to understand in statistical methods in data science.
Predictive models can be used to:
Forecast sales
Predict customer churn
Detect fraud
Estimate loan risk
Recommend products
Predict disease risk
Analyse student performance
Improve business decisions
Regression Techniques
Statistical approaches like linear and logistic regression are very important to Predictive Modeling in statistical methods in data science. For example, regression models may use past data to predict sales patterns, customer turnover, or stock prices.
They are the main parts of many machine learning algorithms in statistics for data science.
Classification Models
Classification models are used to put data into groups that have already been defined. Statistical methods are used to train models like decision trees, random forests, logistic regression, and support vector machines in data science statistics.
For example, a classification model may predict whether an email is spam or not spam.
Model Evaluation
Statistics also helps evaluate model performance through accuracy, precision, recall, F1-score, confusion matrices, and error rates.
Without statistical evaluation, data scientists cannot know whether a model is reliable or misleading.
Ultimately, why statistics is important in data science becomes clear here because it turns data into useful information and strategic benefits.
Handling Missing Data
In the real world, datasets often have missing or partial values. Statistical approaches may deal with these problems by applying procedures like imputation, interpolation, or deleting missing values in basic statistics for data science.
For example, missing customer age values may be replaced with the median age of the dataset if it is statistically appropriate.
Outlier Detection
Outliers may affect analysis and lead to the wrong conclusions. Statistical tools like Z-scores and the interquartile range, or IQR, can help identify and manage these problems in statistics for data science.
For example, one extremely high sales value may distort the average sales figure if it is not reviewed properly.
Data Standardisation
Data standardisation ensures values are placed on a similar scale before analysis or machine learning modelling. This is important when variables have different units, such as income, age, and transaction frequency.
Students wondering how to learn statistics for data science should begin with the core concepts before moving towards advanced modelling.
A useful learning path includes:
Learn descriptive statistics
Understand probability and distributions
Practise hypothesis testing
Study correlation and regression
Work with real datasets
Use visualisation tools
Explore statistical software
Apply concepts in machine learning projects
Students should also practise with examples from marketing, healthcare, finance, education, and e-commerce. This makes statistical learning easier to connect with real data science problems.
Bogged down with complex statistical and data science analysis? Get reliable and affordable academic guidance from our professionals who are seasoned experts in this domain. From proofreading, debugging, visualisation, and formatting, grab student-focused assignment support at our platform.
Check here to learn more:
Subject Matter Experts
From descriptive statistics to natural language processing and deep learning, our subject experts are proficient in different disciplines. Connect with us today and get academic support from specialists who understand statistical concepts and data science tasks.
Robust Data Modelling Support
Our experts showcase robust data modelling expertise with efficiency in retrieval mechanisms, types, and processes. Give any data topic and get structured data modelling guidance for data science assignment help.
High-End Tools Proficiency
From handling statistical software to SQL, programming, and machine learning tools, our experts provide software-based academic support. Students can also get help with statistical interpretation, code review, and model explanation.
Trusted Error Checking
Not just developing drafts, dedicated error and bug checking is also part of our academic review process. Our writers review assignments through technical checks to improve clarity, structure, and presentation.
Reliable Delivery Support
Now get complicated data science and statistics assignment help with reliable academic assistance. Book our assignment services and get support within the agreed timeline.
Students looking for broader academic guidance can also explore best assignment help for different subjects and assignment formats.
To sum up, the contribution of statistics and its methods in data science has major significance, from uncovering complex data patterns to determining variable relationships and more. In fact, statistical learning contributes to data transformation and data visualisation across different sectors.
From healthcare and diagnostics to targeted advertising, e-commerce, finance, and education, its impact is wide-reaching. To know in detail about the statistical methods in data science, the above analysis can be insightful, emphasising how to learn statistics for data science effectively.
For any data science and statistics topic assignment, reach out to Assignment World today for academic guidance, assignment review, and subject-specific support.