235,715
Delivered orders
Searching someone who can help with assignment help online? Hire our best assignment experts and enjoy the best grade.
n today's fast-paced world, completing management tasks on time is challenging for students and managers. Project
rogramming assignments are the tasks and projects which are assigned to the students. These assignments focus on the
I
n today's fast-paced world, completing
management is all about handling things in an organised way and helping to keep the work on track. When the deadline is missed, the entire planning process gets into a vein. This is why having a visual picture helps keep track of each project's schedule and the working status of each task.
management tasks on time is challenging for students and managers. Project management is all about handling things in an organised way and helping to keep the work on track. When the deadline is missed, the entire planning process gets into a vein. This is why having a visual picture helps keep track of each project's schedule and the working status of each task.
Track all those using the graphical representation, which allows management students to maintain the project deadlines well, and that's how Gantt charts software comes into play. It helps analyse and track activities and task status, pending tasks, and task durations using visual pictures. Let us discuss the basics of Gantt chart benefits in detail.

A Gantt chart is a visual representation of a bar chart. It is mainly used to visualise a list of tasks involved in management projects. In detail, the cart displays the start date, end date, deadlines, achievements, and dependencies to track work progress smoothly. The bar chart generally shows a task list on the left side and dependencies on the right side to track the project.
Project managers use the Gantt chart for three main reasons in project management projects. Some of them are:
Build And Manage Comprehensive Projects: Gantt charts represent the whole working section of projects and divide them into smaller parts. This process helps to resolve the dependencies between tasks, allocators and achievements. It helps to complete the task on time and reduces many dependencies.
Determines Logistics And Task Dependencies: Primarily, managers or students use Gantt charts for whole-project task monitoring; Gantt charts in project planning ensure that a new task cannot start until the previous one is completed. At the same time, this tool tracks the delayed tasks and reschedules them automatically in the timeline.
Monitor The Progress of Projects: Users can monitor the status, track the recent process in detail, and readjust according to deadlines. The chart contains all the information, including the start and end dates, achievements, and detailed metrics.
Real-Time Applications
The Gantt chart is mainly used in agile project management to plan and visualise the project status and ensure unfinished tasks. The tool combines the visual timeline with agile methodologies to help the management team plan and track the progress.
Tools
When searching for essential information, an academic writer has to look out for proper sources and relevant data for the dissertation topic. To achieve this, a writer should have good reading skills, with the skills of a writer able to gather the essential data for the dissertation. Reading doesn't mean reading books; it has to be analysing the relevant evidence or information.
Paymoo
Team Gantt
Ganttpro
Wrike
Toggplan
Key Gantt chart benefits of using project management software help students track tasks.
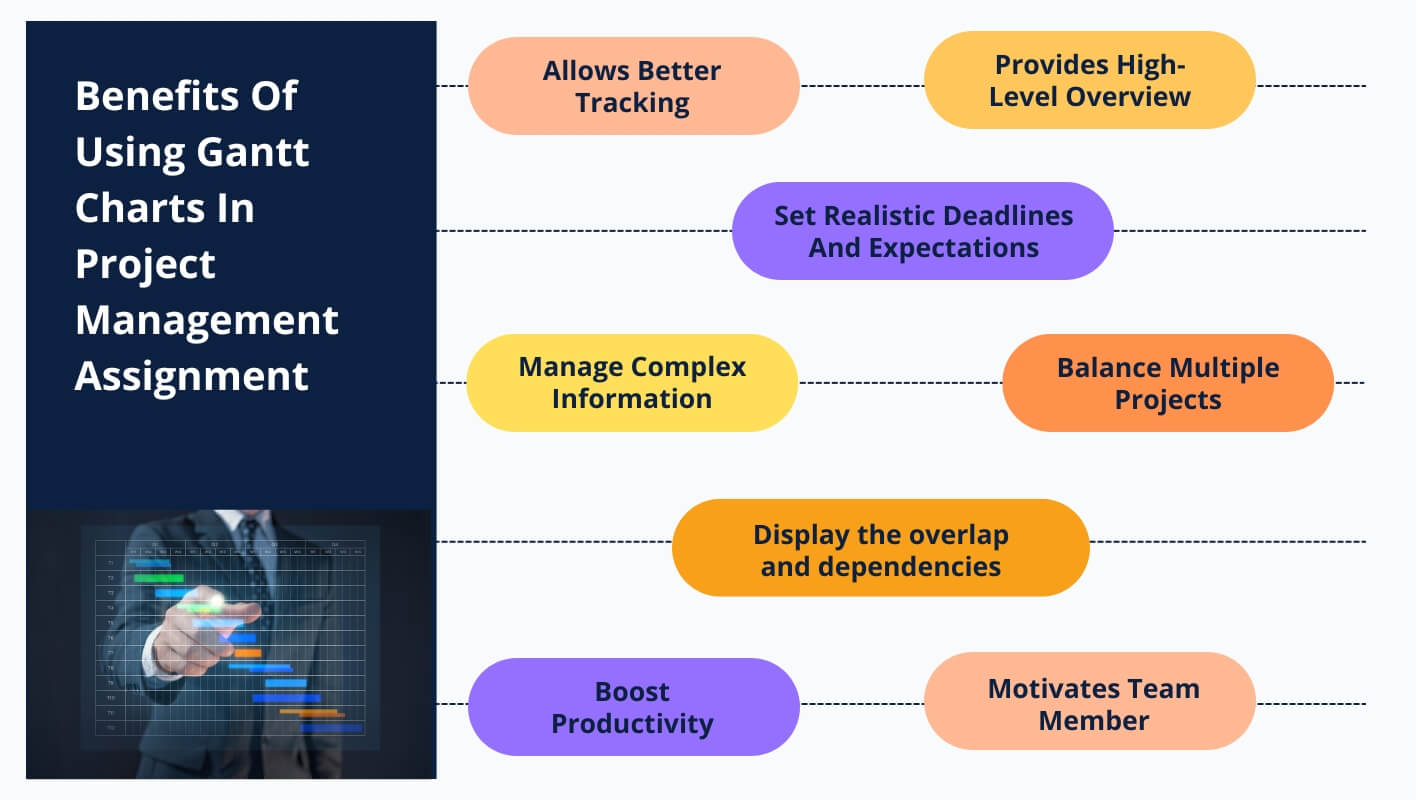
Allows Better Tracking
Gantt charts allow users to track their daily tasks, achievements, and overall project workflows. This chart indicates users with delayed tasks or workflow constraints and helps them manage and adjust according to timelines.
Provides High-Level Overview
This chart is made for executives, project members and stakeholders to review and track the workflow and produce an overall performance. Team members can get analyses from the tools com, Complete their tasks on time, and improve their performance in the timeline.
Boost Productivity
Gantt charts significantly increase workers' productivity during task completion. These tools offer total transparency in working. All the data are tracked on a single system to understand the importance of work to all team members. They also help generate detailed Gantt charts in project planning.
Display the overlap and dependencies
The Gantt chart details the project tasks and how they interact. The tool also explains how to start and complete a job and describes how to schedule tasks, allocate the work, and provide resources to each team member.
Manage Complex Information
Gantt chart visual clearance can be a tool to simplify complex tasks into smaller ones, especially for team members, to complete them in the required time. Though the tools carry transparency, students and team members can understand the requirement and their roles in completing the task.
Balance Multiple Projects
Students and managers can balance tasks, targets and deadlines together using these tools. It gives a better idea about the projects and helps to allocate the resources at the correct time to the team; this tool balances the work and performance better.
Set Realistic Deadlines And Expectations
The Gantt chart bar graph clearly shows the actual data of projects and track records of each one in teams and each task in the team; it displays information at a correct timeframe add, dresses how much time is required to complete all those tasks, and sets a deadline for each task allocates explicit estimation of each task in projects.
Motivates Team Member
The Gantt chart now has all the data and schedules the project requires. These tools play a huge role in project management. It will automatically offer a clear role clarity, estimated tie and resources to complete the task. The tool motivates many project managers, team members, and students to stay focused on the tasks and maintain good workflow in the management.
Crafting an effective Gantt chart involves more than just putting the data and how they represent the given data; here are some eBay practices that students should follow.
Keep It Simple And Clear: Keep data and elements simple in Gantt charts, use different colours and labels for identification, and avoid adding extensive information.
Use Color Coding: Use different colors for different tasks. It will improve the project timeline, help track the work in detail, and offer progress in an easy mode.
Communicate Clearly: Communication is essential when working as a team, ensuring everyone is familiar with Gantt charts usage and how to track the tasks, works and schedules. It will help the team to avoid the last-minute delays.
Update the Chart Regularly: Update the Gantt chart daily and ensure all the data presented in the Timeline is original. Remember to add the daily work data and make corresponding changes daily.
Incorporate Feedback: Seek feedback from the team regularly and incorporate the project information in the Gantt charts to improve accuracy and effectiveness.
Our project management assignment help service in Australia is tailored to assist students in the best possible way. Gantt chart assignments are crucial because the software involved in the tool software, like MS Project, plays a significant role. Students need help with assignments due to less familiarity with Gantt chart software. At Assignment World, we have industry experts who are well aware of the preparation of charts and formulate the reports to get the best from our team and excel in these Gantt charts assignments.
Expert Guidance: Our experts are well-experienced with project management assignments; students get well-structured Gantt chart assignments from our experts.
Professional Design: Our writers work on a lot of research to sleeve a unique design process for students' Chart projects. With professional Design, students can academically elevate their Gantt charts assignment and gain higher grades.
Customised chart: We have extensive experience working on multiple chart projects. Our experts also know various applications to design specific project management requirements.
Gantt Charts are introduced in the academic curriculum to teach students how to manage many project tasks and complete all these tasks in parallel. Gantt charts software is the best tool for students to analyse, track, evaluate, project overview, and project timeline the performance with visual representations. Many project managers use the Gantt chart in project planning to complete the task within a reasonable timeframe. There are a lot of Gantt chart benefits. This tool helps students efficiently complete massive projects.
Suppose you are looking to seek the Gantt charts project assignment work for your academics. Assignment World is the right choice for getting assignment help services to get top-quality visualised data for your projects.