Assignment World
4.9/5
+61 480 020 208
Order Now
Assignment World
4.9/5
+61 480 020 208
Order Now
Order Now

Tap to ChatGet instant assignment help

Home A Guide to Use Statistics in R Programming
Lucy Martin
Updated July 31, 2023
Share and Follow

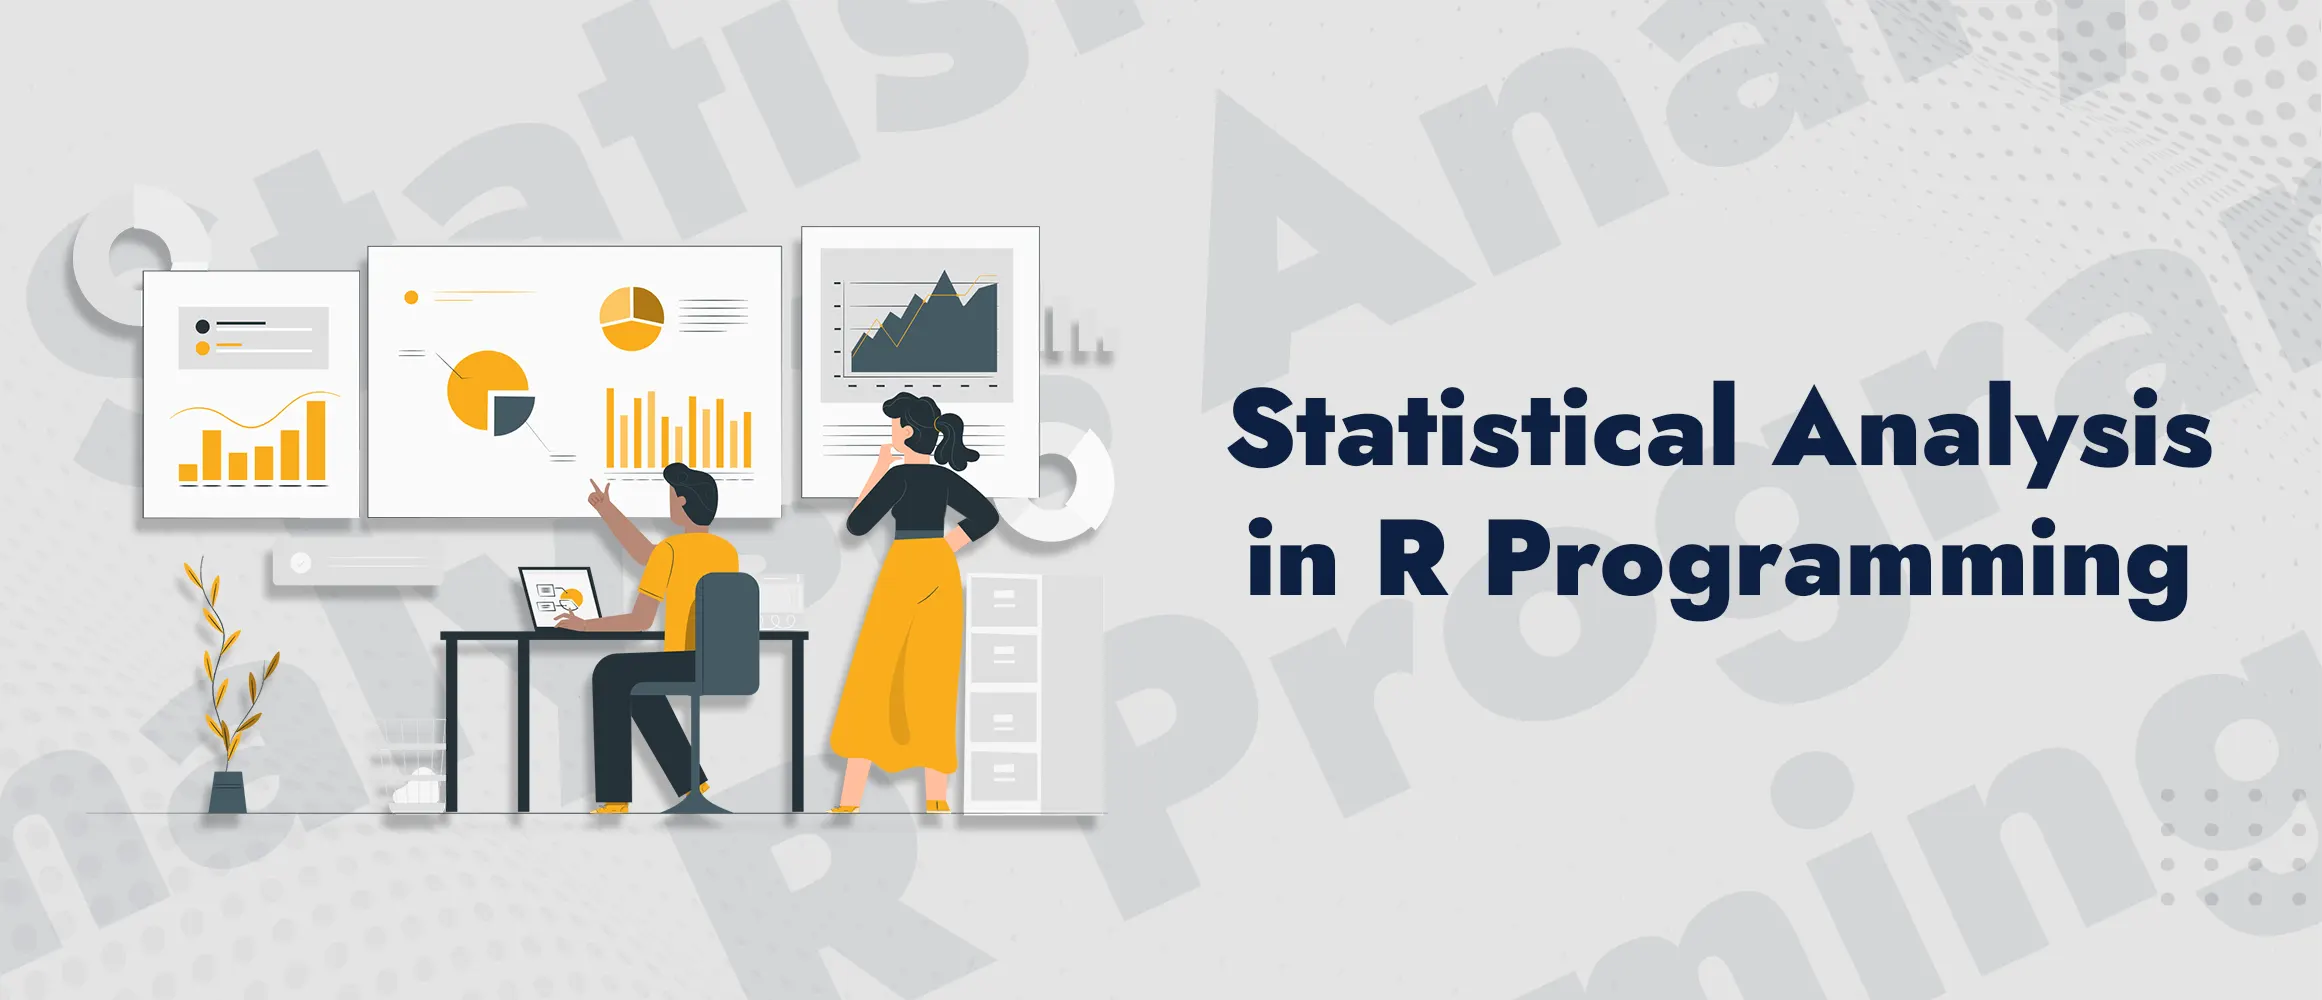
A Guide to Use Statistics in R Programming

The R Programming Language Is A Power Packed And Free Statistical Software Tool That Analysts Use Frequently To Quite Often

how to apply statistics in R programming

Overview on R programming

R

programming is not a tool but an eagerness to unleash strong statistical analysis. It is a scholar diving into research or

P

rogramming assignments are the tasks and projects which are assigned to the students. These assignments focus on the

R

programming is not a tool but an eagerness to

a professional handling Big Data challenges within the industrial context. Just imagine the ability to assemble raw data in a meaningful manner using a simple snippet of code.

unleash strong statistical analysis. It is a scholar diving into academic research or a professional handling Big Data challenges within the industrial context. Just imagine the ability to assemble raw data in a meaningful manner using a simple snippet of code.

This content takes you through the R programming journey, from basic concepts to advanced skills. This will get you, by the end, fully abreast of the skills to exploit R to its full potential in doing statistical analysis and making decisions based on data with confidence.

Blog Page Offers
Get Assignment done
Through Our Certified Experts
Order Now
Offers
Get Assignment done
Through Our Certified
Experts
Order Now
Offer Image

Getting Started with R Programming

R is a language designed especially for statistical computing and graphics. The first thing in mastering the statistics of R programming is the installation of R and RStudio. RStudio is an integrated development environment that helps you work with R more comfortably. After installation, learn its syntax and basic commands. Of prime importance is the R environment: console, script editor, and workspace.

The first thing a novice working in R should master is how to import and handle data. In general, data could be imported from sources like comma-separated values (CSV), Excel, or directly from a database. Commands such as read.csv() or read.table() will help you import your data into R. Once you have your data loaded into R, start with some exploration of the data, using summary() and str() to get an idea of the structure and contents.

Understanding Data Types and Structures in R

Use of R for statistics enforces or necessitates an understanding of the various data types and structures. Some of the data types R handles include vectors, matrices, data frames, and lists. Each of these serves a particular purpose and finds application in a number of statistical analyses.

Vectors: The simplest type, a vector is a sequence of data elements of the same type.

Matrices extend vectors into two dimensions and are especially suited to mathematical operations.

Data frames are most like spreadsheets in that each column may contain a different type of data.

Lists allow several types of data and other data structures too, to be included in them.

Knowing how to manipulate these data structures is key to carrying out effective statistical analyses in R. Accordingly, some of the key functions used will include: creation of vectors through the `c()` function, matrices through the `matrix()` function, and data frames through the `data.frame()` function. Mastering these data structures will provide you with the means to structure your data in an efficient way such that it will be prepared for higher-level analysis techniques.

Descriptive Statistics in R

Descriptive statistics are the cornerstone of any analysis, as they summarise data for you before you head over to more complex analyses. The calculation of mean, median, standard deviation and variance is very easy in R. These statistics give a quick view that may help outline some patterns, trends, and perhaps one outlier.

For example, the mean() command in R computes the mean, median() for median, sd() for standard deviation, and var() to compute variance. Other general functions in R that are generally used in quick statistical summaries of your data include the summary() command. You can plot your data using various plots and histograms; functions plot() and hist(), respectively, shall help you to understand the distribution and central tendencies of your data.

Inferential Statistics in R

Inferential Statistics in R Inferential statistics are any statistics that allow you to make a prediction or inference about a population based on a sample. Some of the many types of inferential statistical tests that can be conducted using R programming include, but are not limited to, t-tests, chi-square tests, and ANOVA.

To perform a t-test using R, for instance, you would use the function `t.test()`. For a chi-square test, you would use `chisq.test()`. These tests are important in giving you an insight into whether your findings are statistically significant besides, usually, getting descriptive statistics. The use of such tests among others forms the core of any data analysis in R programming; especially since most analyses involve samples, not whole populations.

Regression Analysis in R

Regression is one of the powerful statistical methods in understanding the relationship that exists between variables. In statistics, you can conduct both simple and multiple regression analyses using the R programming language with functions like lm() for linear models.

For example, a simple linear regression is executable with the command lm(y ~ x, data = your_data), where y stores the dependent variable and x is the independent one. The output will show the coefficients describing the relationship of the variables along with measures of fit: R-squared, p-values.

With multiple regression, you can include more than one independent variable in a model, so you get a much broader picture of the actual relationship that exists within your dataset. Understanding regression analysis in R programming can help anyone model real-world data to make critical decisions based on statistical evidence.
Advanced Statistical Techniques in R
The advanced statistical techniques that can be reached with increased experience in programming in R concern logistic regression, time series analysis, and clustering. These techniques enable more complex and detailed data analysis, which may be important for deep insights.

Logistic Regression: It is used in cases when the dependent variable is of a categorical nature and most often involves binary outcomes. This can be run using the `glm()` function in R.

Time series analysis: when data are collected or recorded at fixed intervals of time. Such analysis can be done using some standard functions like `ts()` and `forecast()`.

Clustering: This is a form of unsupervised learning in which similar data is clustered together. The `kmeans()` function is among several techniques applicable in this approach in R.

Mastering these advanced techniques using R programming empowers you to solve complex data analysis problems and equips you to be an adept, versatile statistician.
representation of advanced statistical techniques in R programming
Practical Applications of R in Real-World Data Analysis
R programming is not restricted to academic exercises but also finds practical application in other areas.

R programming finds its applications in finance, healthcare, and marketing, among other fields outside the academic domain.

R is used in finance for portfolio optimization and risk analysis.

R in healthcare has been used in analyzing clinical trial data and in predictions related to the outcome for patients.

Marketing professionals use R to implement customer segmentation and predictive analytics.

The ability to apply statistics using R programming on a real-world problem allows one to develop a model that could potentially provide information on decision-making and strategy. It is through these applications that the R programming of statistics has become such an invaluable tool in today's data-driven world.

Regression Analysis in R

Indeed, Assignment World is very supportive of students and professionals looking forward to mastering statistics in R Programming Assignment Help. From basic concepts to advanced techniques, Assignment World has expert guidance suitable for your needs. The platform guides you through the challenges you face in R programming in statistics so that you can apply your knowledge effectively.

Tutorials, sample projects, Customized tutoring sessions and Stats capability guidance in R programming make it easier for freshers who are starting with R programming or are a bit weak in understanding complex statistical methodology. The Assignment World enables quicker learning with the stats capability in R programming.
235,715
Deliverd orders
2,150
Experts
4.9
Client Ratings
Conclusion
The knowledge of statistics in R programming unleashes many opportunities, from basic descriptive statistics to advanced methods of data mining, such as regression analysis and clustering. Programming of statistics in R is, therefore, a necessary skill for all practitioners who are into decision-making based on data. By following the guide on how to go about statistics in R programming, including using Assignment World for resources, one can execute each theory apt for study and career building. The journey of mastering R programming in statistics is arduous but rewarding; the opportunities for growth and success are unlimited in this field of data analysis.
Share and Follow
FAQs
What is R programming, and for what reasons is it so extensively
utilized for statistical analysis?
R programming is a language and environment developed especially for statistical computing and graphics. It is being highly utilized today because of its comprehensive resources to perform data analysis, broad sets of libraries for statistical packages, and excellent community support. In academia and industry, R is specially liked for performing simple tasks related to data manipulation to advanced statistical modelling.
How to get started with statistics in R programming for a beginner?
Install R and RSTUDIO, the most popular integrated development environment for R. As a novice, start learning the very basic commands of R, vectors, matrices, data frames, etc. You can just start with importing the data, explore it using descriptive statistics, and then gradually move on to more complex analyses.
What are some key functions in R to perform descriptive and
inferential statistics?
The functions used for descriptive statistics are mean(), median(), sd(), and summary(). For performing the inferential statistics, the generally used functions are t.test(), chisq.test(), aov() for ANOVA. These functions will allow you to summarize data, test hypotheses, and make conclusions from your data sets.
Can I also do advanced statistical methods in R like performing regression analysis?
Yes, R does a good job with advanced statistical methods, such as performing regression. You can use the `lm()` function for linear regression and `glm()` function for logistic regression. R supports many other advanced methods like time series analysis, clustering, etc.
Why Programming Assignments Are Challenging And How To Overcome?
R programming are complex and therefore many students find it difficult to understand. Assignment World provides tailored support to students and professionals alike in order to become proficient in statistics using the R programming language. It includes tutorials, personalized tutorials, and sample projects that suit every level of professional and academic application. You can solve your problems regarding R programming and enhance your skill level in the application of statistical methods more effectively with the help of Assignment World.
Offers

Get Assignment done
Through ADW Certified
Experts

Order Now
Offer Image
Offers Cyber Monday Sale
Get Assignment done
Through Our Certified
Experts
Order Now
Offer Image
Support
Especial & Unprecedented
Affiable Admins
24X7 At Hand
WhatsApp At Hand
Order Now
Subjects
Management
Accounting
Math and Stated
Engineering
Science
Law
Economics
Offers

Get Assignment done
Through ADW Certified
Experts

Order Now
Offer Image
Related Blogs
Support
Especial & Unprecedented
 Affiable Admins
24X7 At Hand
WhatsApp At Hand
Order Now
Your First Order Get 20% Off!
Subscribe Form
We Accept
Visa LogoMaster card Logo
American Express LogoPaypal Logog
Copyright © 2023 Assignment.world. All rights reserved.